Energy

Background
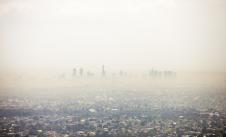
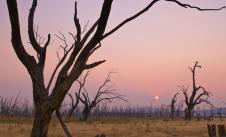
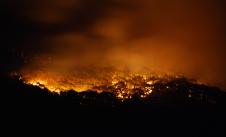
Measured globally, the energy sector is responsible for nearly three quarters of greenhouse gas emissions. These emissions have caused a 1.1°C increase in global average temperatures since the pre-industrial era. This rise in temperature has led to noticeable effects on weather and climate extremes.
The role of energy in emissions is proportionately higher in Australia. And is higher still in Victoria relative to Australia. This is due to the dominance of coal in electricity generation in Australia. Burning coal produces electricity, but the process also produces a much greater amount of greenhouse gas emissions compared with renewable sources (e.g. solar and wind).
This key topic looks at information and evidence to support conclusions on how the energy sector is impacting the environment in Victoria.
The Victorian Government has a legislated target to achieve net zero emissions by 2050. However, the Government has committed to bringing forward its net zero emissions target by 5 years, to 2045.
In 2021, the International Energy Agency (IEA) identified 4 measures to achieve the low emissions revolution it says is long overdue:
-
A massive additional push for clean electrification … accelerating the decarbonisation of the electricity mix is the single most important lever.
-
A relentless focus on energy efficiency.
-
A broad drive to cut methane emissions from fossil fuel operations.
-
A big boost to clean energy innovation.
The indicators in this key topic primarily focus on greenhouse gases, which is the dominant environmental issue for the energy sector. Technological improvements are helping improve the energy efficiency of the appliances and lighting in our homes. This means we can achieve reduced energy consumption and greenhouse gas emissions without compromising our quality of living.
Our current knowledge suggests a reduction in energy consumption is not negatively impacting Victoria’s economy. Our energy use is becoming more efficient and we're getting more value from the energy we use. For example, our energy consumption per person has reduced by more than 30% since 2008, while our gross state product (GSP) per unit of primary energy has increased by more than 60%.
In the key topic Climate Change, the indicator CC:11 ‘Annual greenhouse gas emissions', makes it clear that a substantial task lies ahead to reduce emissions in Victoria. And the energy sector — mainly electricity generation but also energy in transport — will be the focus. The indicators in this key topic show Victoria is tracking well at decreasing the proportion of electricity generated by fossil fuels. However, there is still a long way to go. There’s also a big task ahead for transport, but little progress has been made in that sector.
There are other environmental issues, besides greenhouse gases, associated with energy production and consumption. These are not included in this analysis. Examples of such adverse environmental impacts include, in the case of fossil fuel use:
-
hazard (ash) disposal
-
water consumption
-
and river system effects.
For renewables, adverse effects can include impacts on fauna (particularly avian) and loss of biodiversity, for example habitat losses are associated with land being used for solar or wind power infrastructure. The transition to renewable energy will impact on biodiversity by using land for solar and wind farms and electricity transmission. Additionally, the construction of new transmission lines can potentially impact the productivity of agricultural land by disrupting existing farming practices.
Overview
The 2023 assessments represent a significant improvement for the energy sector compared with the SoE 2018 Report.
The indicator trends in 2018 were generally assessed as improving, which is consistent with the upgrade in status assessments reported in 2023.
Victorians are consuming less energy per person (E:01) with fewer greenhouse gas emissions from the energy sector per capita. That’s in comparison to the Australia-wide averages for those measures. However, when compared with the per capita energy consumption of most G20 countries, Victoria’s consumption remains relatively high.
In Victoria, greenhouse gas emissions per capita from the energy sector were reduced by 36% between 2010 and 2020. This is a larger percentage reduction than any other Australian state or territory during that period.
However, an even greater reduction of 68% is needed in the next decade to meet the International Energy Agency's 2030 target for achieving net zero emissions by 2050.
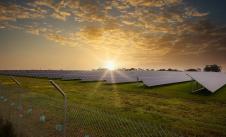
There's a growing trend of replacing coal with renewable energy sources in the production of electricity. This shift is leading to improvements in the environment within the energy sector. In E:04 the percentage of electricity generated in Victoria is measured by ‘fuel’ type – e.g. solar, wind, coal. The data highlights renewable sources have increased and are now contributing 30% of Victoria's electricity generation. This is an improvement of 6% from 2008-09. Coal has dropped to 66% (down from 92% in 2008-09). The Victorian Government has a legislated renewable energy target that sets out the percentage of electricity to be produced in the state from renewable sources. Its target of 25% by 2020 has now been met. However, further improvements are required to reach the next target of 40% by 2025.
The Victorian Government has also committed to increase its 2030 renewable energy target. It is proposed to increase from 50% renewable electricity generation to 65%. And it intends to legislate a target of 95% renewable electricity generation by 2035. This highlights how critical the next decade is for renewable energy transition in Victoria.
The power system is rapidly diversifying. Therefore, it will be valuable for the Victorian Government to establish and publish data tracking the progress to variable renewable generation (e.g. solar and wind power).
Despite the gains by renewables for electricity production, emissions from fossil fuel fired electricity generation accounted for 41.7 million tonnes of carbon dioxide equivalent (Mt CO2-e) in 2020. This was approximately half (50.1%) of Victoria’s total net emissions. Coal remains the dominant fuel source for electricity generation in Victoria. It offsets the relatively high penetration of renewable sources when benchmarked against G20 countries.
There has only been a small per capita gas consumption (E:05) decline in Victoria (in comparison to electricity). And an under-performance in Victoria relative to South Australia and New South Wales for per capita gas distribution.
Gas prices are rising steadily. Greenhouse gas emissions from residential fuel combustion are increasing (e.g. natural gas heating). And geopolitical and economic events are causing uncertainty in gas supply and price globally. Victoria needs to prioritise reducing gas consumption and associated greenhouse gas emissions. Over 2 million Victorian homes and businesses use gas — more than any other state or territory. It’s important to track the transition away from natural gas in residential water heating and space heating. To enable this, it's critical to report data on the energy consumed by water heaters installed each year, and in the total residential sector, classified by fuel type.
Victoria’s performance in energy consumption and greenhouse gas emissions in transport (E:06) is poor, compared to reducing greenhouse gas emissions in stationary energy where a transition from fossil fuels (e.g. coal-fired power plants) to renewable energy is well underway. Energy use and greenhouse gas emissions from transport are both less than the previous SoE reporting period. However, this is more likely due to a reduction in travel associated with the COVID-19 restrictions than other factors that would contribute to an enduring change.
Total energy consumption per capita in Victoria has been declining annually since 2009, except for a minor increase in 2018. However, energy consumption from transport remained stable until the implementation of travel restrictions during COVID-19. The travel restrictions resulted in reduced energy consumption in transport, significantly influencing energy consumption trends in 2019-20 and 2020-21. In terms of greenhouse gas efficiency in the transport sector, there have been no significant changes since data was first available in 1990.
Reducing greenhouse gas emissions from the transport sector, will require a combination of:
-
Fossil fuel energy use per person declining at a faster rate than population growth
-
Technological advancements reducing greenhouse gas emissions from transport.
Report card
| Location | |||
|
Statewide |
|||
| Location | STATUS | TREND | CONFIDENCE |
|
Statewide |
|||
| Location | |||
|
Statewide |
|||
| Location | STATUS | TREND | CONFIDENCE |
|
Statewide |
|||
| Location | |||
|
Statewide |
|||
| Location | STATUS | TREND | CONFIDENCE |
|
Statewide |
|||
| Location | |||
|
Statewide |
|||
| Location | STATUS | TREND | CONFIDENCE |
|
Statewide |
|||
| Location | |||
|
Statewide |
|||
| Location | STATUS | TREND | CONFIDENCE |
|
Statewide |
|||
| Location | |||
|
Statewide |
|||
| Location | STATUS | TREND | CONFIDENCE |
|
Statewide |
|||