Waste

Background
Take, make, dispose. This is the throw-away approach to the product lifecycle. It’s the basis of a linear economy.
Not only does this model place a large economic toll on governments – costing them millions of dollars annually to manage waste – but it also places intense pressures on the natural environment at each stage of the cycle as well.
The linear product life cycle begins with removing raw materials from the earth to make new products. The process of extracting these materials depletes our finite stocks of natural resources to meet excessive production demands. Making new products requires more power and water than recycling and reusing materials from existing products. This means that continuously producing new products intensifies issues of water scarcity and greenhouse gas emissions, contributing to climate change.
The higher the demand for products by consumers, the greater the rate at which the ‘take-make-dispose’ cycle occurs. Planned obsolescence of products also propels the pace of this cycle even further.
Once produced, products then move through distribution channels to reach consumers. The further products travel to reach their end consumers, the more resources are used to get them there, and the more emissions are produced. The longer the supply chain, the greater the cumulative impacts on the environment.
Once consumed, products reach their final stage – landfill – where the value of their materials are lost. Here, waste can produce harmful pollutants that enter the environment and the air. These can impact the health of humans and biodiversity and further contribute to greenhouse gas emissions.
A recycling model is an improvement on the linear approach to production and consumption. It focuses on the end of the product lifecycle. When products reach their end-of-life, useful materials are recovered and processed for reuse.
In Victoria, material recovery for export and local reprocessing has increased since the SoE 2018 Report (rising from 8 Mt to 11 Mt). However, the amount of waste being generated in the state also showed a continuous increase (peaking at 15.9 Mt in 2019-20). The amount of waste being diverted from landfill remained relatively stagnant (70%) during this same time period. This means progressively more waste has been ending up in landfill each year (since 2013-14), with some of this being recyclable material.
It's important to note that not all recovered material is recycled. Some is exported (where the fate of the waste in the receiving country is unknown) and some is disposed of due to contamination.
However, a recycling model is not enough to ease environmental pressures or overcome the amount of waste being generated in Victoria. It only targets the issues at the disposal stage of the product life cycle, as opposed to reducing our dependence on environmental resources and preventing the generation of waste and pollution in the first place.
A circular economy is seen as the pathway towards a more sustainable future by addressing issues at the source. Unlike the linear and recycling economic models, a circular economic model is a restorative, closed-loop system. It is underpinned by 3 principles:
-
elimination of waste
-
circulation of products and materials at their highest value
-
regeneration of nature.
The Victorian Government recognised the limited contributions recycling alone provides towards reducing waste loads and environmental pressures. In response, they released their new waste policy, Recycling Victoria: A New Economy, in February 2020. It aims to transition the state to a circular economy. The policy puts forth a roadmap for achieving targets towards:
-
reducing waste generation and organic waste disposal
-
increasing the amount of waste diverted from landfill
-
reforming and standardising household recycling systems.
Victoria is moving forward in its transition to a circular economy. To do so, it must establish the essential architecture needed to meet targets set under the circular economy policy. It will face the following challenges:
-
providing comprehensive waste data systems and reporting
-
fulfilling identified resource recovery infrastructure capacity and capability shortfalls
-
avoiding and reducing waste across waste streams and source sectors
-
producing high quality recyclable materials
-
eliminating pollution
-
managing unintended and emergent contaminants.
Overview
Waste continues to be a significant management issue in Victoria. The waste and resource recovery indicators showed few demonstrable improvements since the State of the Environment (SoE) 2018 Report. Most indicators (5 of 6) have either declined or maintained an assessment of poor. There were external factors that contributed to these outcomes. These factors significantly impacted Victoria’s waste and resource recovery sector, particularly within the municipal solid waste (MSW) sector.
In January 2018, China began enforcing restrictions on the importation of recycled materials under its National Sword policy. This impacted the global market for recyclable material. It effectively removed a key market Victoria had historically relied heavily on for trading sorted recyclables. It revealed the limitations in Victoria's waste and resource recovery sector due to the restricted options for exporting.
Local reprocessing capacity and capability were inadequate to manage the volume of Victoria’s recyclable material or the rapid concentration of waste generated by the municipal solid waste (MSW) sector. This was further compounded by the impact of the COVID-19 pandemic stay-at-home restrictions and the lack of local demand for recovered materials. Increases in contamination levels among household recyclable materials also lowered their value and potential for recovery. Contamination occurs when non-recyclable items are co-mingled with recyclable material before collection. The household recycling system reforms and the recent launch of the container deposit scheme are aimed at addressing this issue.
Limited capacity to export or manage recyclable materials locally led to excessive stockpiling among some recovery facilities. What occurred were several illegal incidents among resource recovery facilities and their ultimate closure. With the loss of these facilities, significant quantities of household recyclables were landfilled during 2019 and 2020. Costs to local governments for managing waste rose.
Total waste generation (W:01) has been on an overall upward trajectory since 2012-13. The amount of waste produced rose at a more rapid rate (10%) and peaked at a higher level (15.9 Mt) during the SoE 2023 reporting period than during the SoE 2018 reporting period.
By 2019–20, Victoria had discarded more waste than in any other year. The pattern of waste generation was also found to follow a linear model. This means that growth in waste levels trended in line with increases in the state’s gross state product (GSP) and surpassed the rate of population growth.
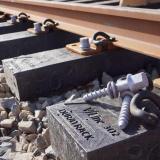
The greatest contributor to the state’s rise in generated waste in recent years was the construction and demolition (C&D) sector, likely due to an increased level of infrastructure development and improvements in the state (e.g. the Big Build program of works) to accommodate the state's growing population.
When removing the effects of population growth, the pattern of rising waste generation in the state persists – suggesting that factors other than population size is influencing these observed patterns. Indicator W:02 found that in 2017-18, 1,188 kg of per capita waste (W:02) was generated. This gradually increased to 1,225 kg by 2019-20 due to more garbage being produced. Unlike the increasing amount of per capita waste entering landfill annually, resource recovery declined modestly overall (1%) across the 3-year period data was available. This is despite recyclables maintaining a larger proportion of per capita waste totals.
W:04 measures the proportion of generated waste recovered and not sent to landfill. Diverted waste is not necessarily recycled. The recovered material is either reprocessed locally or exported with an unknown fate (some may be disposed of and some may be recycled in the receiving country). W:04 found the rate at which Victoria was diverting waste from landfill has improved little since 2010-11. It ranged from 63% to 70%, with the rate of increase slowing in the more recent years (2017 to 2020). This modest increase of 5% across SoE reporting periods contrasts with the growth seen in both waste generation (32%) and disposal (20%) since 2012-13. This means Victorians are disposing of more waste every year.
In 2019-20 alone, Victoria landfilled an estimated 4 Mt of recyclable material. This contributed nearly 3 Mt (3%) to the state’s total greenhouse gas emissions. Local governments spent approximately $556 million towards managing household waste.
The C&D sector had the highest diversion rate of all source sectors. They recovered between 84% and 87% of generated waste. Increasing reliance on recycled materials for infrastructure projects contributed to much of this growth. This construction practice was standardised in 2020 under the Recycled First policy. It directs organisations delivering major transport projects to prioritise the use of recycled and reused materials over new materials. By contrast, the commercial & industrial (C&I) and MSW sectors presented the largest scope for improving resource recovery. They had markedly lower rates of waste diversion.
As extensive COVID-19 pandemic stay-at-home orders caused dramatic reductions in business operations, local governments were faced with having to unexpectedly adapt to the Victorian Government’s response to the pandemic and manage the large volumes of generated waste that was shifted out of the C&I sector and concentrated to within the MSW sector.
In 2019-20, household waste generation increased by 16%, while recovery rose to a record high of 29%, prompting the sector’s diversion rate to also grow to reach 48%. Reforms to household recycling services, such as the 4-bin system, was thought to have played a role. The key aim of transitioning to a standardised 4-stream recycling system is to maximise recovery among households by reducing contamination-related losses of potentially recyclable materials and improve the quality of recycled products for reuse, both of which are issues common to conventional co-mingled collection systems.
Indicator W:03 found the total amount of food waste generated in Victoria has fluctuated across the SoE reporting periods. It had demonstrated an overall decline from 2013-14 (1.2 Mt) to 2018-19 (1.1 Mt). There was an overall 5% decrease in food waste generation in the SoE 2018 reporting period. However, following this, food waste has begun to increase in recent years. Households being by far the greatest contributor to the state’s food waste totals (70%). Food waste continued to represent a dominant waste stream entering landfill. This was especially evident during 2018-19, where 16% of the state’s total disposed waste was food material. This equates to 711 Kt of food entering landfill.
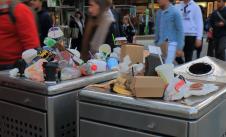
Indicator W:05 reports that the amount of litter has been declining overall since the SoE 2018 Report. However, there has been a small increase in recent years. Despite continued reductions in total annual litter items, the proportion of litter streams have remained relatively unchanged. Beaches and parks had less volume of litter than sites within the built environment, suggesting that litter reduction campaigns targeted at coastal environments are effective in promoting behavioural change. Driving much of this observed decline in litter was a reduction in the number of cigarette butts. Cigarette butts consistently were the largest litter type across years. Illegal dumping, plastic bags, and other glass litter types contributed the least. Illegal dumping rates have been on the rise since the SoE 2018 Report, with peak dumping volumes occurring in 2018–19.
W:06 found that hazardous waste has been on the rise in the state. Victoria reached its highest levels of hazardous waste by 2019–20. Thus making the state the jurisdiction with the second highest hazardous waste in Australia. The level of growth was 24% in the SoE 2023 reporting period, compared to 5% during the previous reporting cycle. Much of this recent growth was driven by greater amounts of asbestos, waste oil/water and contaminated soils. As of 2019–20, large-scale development projects resulted in contaminated soils exhibiting unprecedented growth, to become the largest single contributor (59%) of hazardous waste in Victoria.
During this same year, the effects of the COVID-19 pandemic began to emerge. The healthcare and aged care sectors, and communities to a smaller degree, began generating greater levels of personal protective equipment (PPE) hazardous waste. This prompted a sharp rise in clinical waste, which required management. It also required greater levels of interstate movement of hazardous waste to cope with the influx of PPE.
Issues with the accuracy, breadth, and methodology of annual waste data collection and reporting reduces our understanding of waste generation and recovery patterns in Victoria. In turn, this affects the evaluation of progress towards the state's circular economy targets.
These issues were highlighted within several inquiries and audits of Victoria’s waste and resource recovery sector. This led to mandated changes under the new legislative framework to modernise the state’s waste data collection systems. The intended long-term gains arising from these actions have not yet been fully realised. Information gaps remain in the annual waste reporting. Therefore, data confidence for several waste and resource recovery indicators reported has been reduced.
Report card
Waste and resource recovery
| Location | |||
|
Statewide |
|||
| Location | STATUS | TREND | CONFIDENCE |
|
Statewide |
|||
| Location | |||
|
Statewide |
|||
| Location | STATUS | TREND | CONFIDENCE |
|
Statewide |
|||
| Location | |||
|
Statewide |
|||
| Location | STATUS | TREND | CONFIDENCE |
|
Statewide |
|||
| Location | |||
|
Statewide |
|||
| Location | STATUS | TREND | CONFIDENCE |
|
Statewide |
|||
| Location | |||
|
151 survey sites primarily located across Melbourne suburbs, 15 rural highway survey sites |
|||
| Location | STATUS | TREND | CONFIDENCE |
|
151 survey sites primarily located across Melbourne suburbs, 15 rural highway survey sites |
|||
| Location | |||
|
Statewide |
|||
| Location | STATUS | TREND | CONFIDENCE |
|
Statewide |
|||