Inland waters

Background
'Water is alive. Water is our life. Water sustains and creates, water has spirit. Water is central to our culture, identity, and cultural economies. Water is the lifeblood of Country.'
– Water is Life, Traditional Owner Access to Water Roadmap (2022).
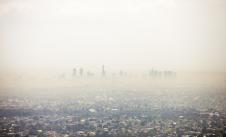
As Victoria's population grows, the demand for water is increasing and climate change is placing even more pressure on the quantity of fresh water. Having good quality water is vital, not only for human health and recreation, but also for the environment, culture and agriculture.
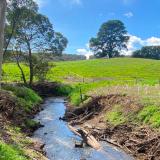
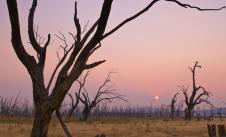
However, more than half of Victoria’s native vegetation and habitats have been cleared since colonisation. This loss of vegetation has led to erosion and increased runoff, as well as sedimentation of waterways and rising salinity levels. All of this can affect the quality of our water. There are many other ways water quality can be degraded, including:
-
water pollution by waste, sewage and septic tank discharges
-
fertiliser and pesticide runoff from agricultural land
-
nutrients, sediments, oil, metals, and litter in stormwater runoff from urbanised areas
-
cold-water pollution downstream of dams and hot-water discharges from power stations
-
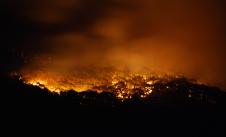
the impacts of climate change, including droughts, floods, bushfires and other extreme weather events.
Victoria's Traditional Owners and Aboriginal Victorians managed water sustainably for tens of thousands of years. The Victorian Government is now working with Traditional Owners to strengthen their role in water planning and management. This is being done through the inclusion of Aboriginal values and traditional ecological knowledge. This is supported by amendments to the Water Act 1989 that has updated its list of purposes to include:
'To ensure that Victoria's water resources and waterways are managed in a way that considers Aboriginal cultural values and uses of waterways; and the social and recreational uses and values of waterways.'
These are important changes and come at a time when Victoria's water resources are under increasing pressure from climate change and population growth.
Projected population growth by 2040 in the Melbourne regions ranges from 25% to 135%. In rural regions projected population growth ranges between a 6% decrease in the Wimmera (the only region projected to experience a decrease) to a 54% increase in Goulburn Broken. Such growth will place greater pressure on water resources already impacted by climate change.
In the Melbourne regions, temperatures are projected to increase by 1.3°C by 2040, and rainfall to decrease by 2.4%. The picture is more varied in the rural regions. Projected temperature increases range from 0.5°C to 2.6°C and rainfall decreases range from 3.7% to 14%.
Over recent decades, Victoria has had reduced rainfall in the cooler months, when most rainfall usually occurs. This is expected to continue. Projected increases in summer rainfall are unlikely to offset the decline.
In this context, it’s critical to appropriately balance the water allocations for consumption and the environment.
Why is environmental water needed?
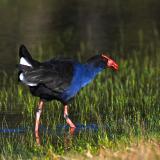
Environmental water is water that’s managed to improve or maintain the health of rivers, floodplains, wetlands and estuaries — including the plants and animals that depend on them.
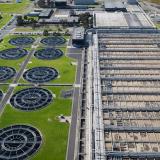
Many of Victoria's river systems have been modified to provide water for towns, industry and food production. Instead of flowing naturally through the landscape, some water is now captured in dams and weirs. It's then diverted for human use via pipes and man-made channels. As a result, some of our rivers give up more than a third – and sometimes half – of the water that would have naturally flowed in them throughout each year.
Balancing water for consumption and the environment in Victoria has been a critical part of water policy since the 1990s. Water extractions of any volume from surface water or groundwater will change natural systems. This can often have significant ecological, biological, chemical or geomorphic impacts. Providing water for the environment can protect or restore biophysical values. This means the various water-dependent social, cultural and economic values can be sustained.
Overview
The reporting period for this key topic covers 2018 to 2021. It compares the results with those for 2010 to 2017.
The years 2018 and 2019 were dry, followed by the wet years of 2020 and 2021.
Water quality
There are several differences between the results for the water-quality indicators in the 2018 and 2023 SoE reports. This is due to several factors:
-
2 wet years (2020 and 2021)
-
the 2019–20 bushfires
-
the availability of data from the Water Measurement Information System (WMIS), which has been used to assess water-quality against the water-quality objectives of the Environment Reference Standard (ERS) which were developed after the SoE 2018 Report.
The WMIS contains real-time data delivered hourly for all telemetered surface-water gauges (including water level, flow and water quality) and groundwater bores (for water level and water quality). As a result, water-quality data improved significantly. Data is collected through Regional Water Monitoring Partnerships that include:
-
Department of Energy, Environment and Climate Action (DEECA)
-
Victorian Catchment Management Authoritys (CMAs)
-
local councils.
Urban development and population growth, agricultural land management, irrigation and climate change are impacting on water quality and aquatic biodiversity in Victoria. Indicator WQ:01 shows that blue–green algal blooms are becoming more frequent, of longer duration and spread over a larger area. However, data limitations prevent an assessment of status. Blue-green algae are types of bacteria known as Cyanobacteria. 'Algal Bloom' is the term used to describe an accumulation of algal cells to a point where they discolour the water, form scums, produce unpleasant tastes and odours, affect fish populations and reduce the water quality. Decomposing algae can also cause depletion of oxygen and induce fish kills.
WQ:02 to WQ:07 make up the physicochemical indicators of water quality:
-
dissolved oxygen
-
nitrogen
-
phosphorus
-
turbidity
-
pH.
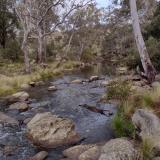
These vary considerably across Victoria’s catchment regions. Water quality is generally highest in the east of the state, where forest cover is largely intact. It then declines westwards as urban and agricultural development intensify.
WQ:08 provides an overall assessment of water quality for each catchment, incorporating the results from indicators WQ:03 to WQ:07. In the SoE 2018 Report, indicator WQ:08 was assessed on a statewide basis and was determined to be poor. In this report the assessment results are presented by CMA region. This shows that in some regions water quality has improved.
The SoE 2018 Report identified critical challenges facing Victoria’s management of water-quality impacts now, and in the future. These remain relevant 5 years later. The challenges included:
-
balancing waterway health with human and agricultural water consumption
-
managing urban development and its impact on urban waterway health
-
maintaining long-term water-quality monitoring data so it’s easily accessible and can inform policy and strategy.
It is also necessary to mitigate against:
-
increasing stormwater and wastewater discharges from urban areas
-
altered water regimes, salinity and algal blooms
-
an increase in catchment inflows from diffuse sources.
Additionally, localised events such as heavy rainfall, can impact individual water-quality parameters. These parameters include:
-
nutrients
-
sediments
-
toxicants
-
pathogens.
Water resources
The assessments for most water resources indicators are the same or similar in 2018 and 2023 reporting periods. One key difference is that WR:03 ‘Surface water harvested for consumptive use’ was rated as poor in 2018 and is now rated as fair in 2023. Indicator WR:01 ‘Water resources and storage trends’ shows that since the SoE 2018 Report water storage levels have been variable, falling to below 40% of capacity in 2020 and rising to almost 100% in late 2022. While there has been a long-term decline in storage levels, recent levels are slightly higher than the average during the Millennium Drought. Increasing pressure on the state’s water resources are:
-
the long-term decline in inflows and storage levels
-
the projected growth of Victoria’s population from 6.7 million to 11 million by 2056
-
the anticipated impacts of climate change.
The use of groundwater and manufactured water is projected to increase. One of the aims of this would be reducing reliance on river water and helping stressed rivers recover.
Indicator WR:02 describes the important role that small farm dams play in rural communities. These dams provide water for stock, irrigation, gardens, domestic use and recreation. They provide habitat and refuges for frogs, waterbirds, invertebrates and reptiles, and can be used to support threatened species. However, farm dams can also impact streamflows by intercepting surface runoff. They can negatively impact aquatic life as well as downstream water consumers. Their number and storage volumes increased rapidly during the early stages of the Millennium Drought, but growth has now slowed. The limited monitoring of the smaller unlicensed farm dams limits analysis of the scale of their impacts.
WR:03 shows that waterway health is directly impacted by diverting water for human consumption. Steamflows represent the flow of water in streams, rivers and other channels. Reduced streamflows place stress on ecological functions and aquatic life in waterways. Many waterways across the state rated poorly for hydrology in the Index of Stream Condition (ISC) released in 2013 and based on 2010 data. The impacts of climate change on stream flows will make improvements difficult.
Indicator WR:04 assesses compliance with water-extraction entitlements to support management of water resources and reduce impacts on aquatic ecosystems. The Victorian water entitlement framework sets out the ways in which individuals, companies, government and water corporations can share water. In Victoria, all surface water systems and groundwater systems are capped. Any extraction within these limits is legally permissible and deemed to be a sustainable level of take. Data for each of the 29 river basins in the state shows there has been compliance with bulk entitlements, with take below the available water resource. Setting entitlement caps doesn’t incorporate an environmentally sustainable level of take though. As pressure on Victoria’s water resources increases, greater use of recycled water (WR:05) and treated stormwater will be needed to address shortfalls. However, the percentage of wastewater being recycled hasn’t increased over the past decade. This is due to several factors, including uncertainty in demand. Rainfall can impact our demand for recycled water usage, with rainfall levels influencing the volume needed for irrigation, which is the predominant end use of recycled water. Appropriately treated recycled water can also be used to boost environmental flows.
Agricultural irrigation is the dominant user of surface water, groundwater and recycled water in Victoria. Efforts to improve irrigation efficiency are the focus of indicator WR:06. The Australian and Victorian governments have been investing in the modernisation of irrigation to improve agricultural productivity and the efficiency of water use. The saved water could be used to expand the land area under irrigation or to supplement environmental flows. Data on farm irrigation improvements are limited. However, surveys indicate that irrigators are improving the efficiency of their water use. And they’re using the gains to increase the resilience of their irrigation activities during dry periods when water allocations are lower.
Groundwater levels and consumption vary considerably across the state, as illustrated by the assessment for indicator WR:07. While many groundwater levels are stable, some are rising and others – in northern Victoria and Gippsland – are declining. Rising levels could indicate sustainable groundwater use; however, they could also lead to increased saline discharges and dryland salinity. Declining levels could indicate unsustainable use. Groundwater levels are generally expected to decline in the longer term. Data on the outcomes of this long-term decline are limited, particularly relating to the impact on groundwater-dependent ecosystems such as wetlands.
Water resources in the 2018 and 2023 SoE reports highlights:
-
the ongoing impacts of climate change, population growth and change of land use on water storages, stream flows, groundwater and consumptive uses of water resources
-
the relatively low volume of recycled water as a percentage of wastewater produced
-
the lack of consistent and statewide data on improvements in irrigation
-
variations in groundwater conditions and levels across the state, with many stable, some declining and several rising, with concentrations of high use in the state’s north and in Gippsland.
Water for the environment
As per the Water Act 1989, water for the environment is delivered for the purpose of preserving the environmental values and health of water ecosystems, including:
-
their biodiversity
-
ecological functioning
-
the quality of water
-
the other uses that depend on environmental condition.
Current monitoring and reporting of environmental watering by the Victorian Government is intended to improve the use of environmental water at a given time in a particular location. This contributes to better localised management of environmental water. However, there is a knowledge gap, with no quantitative analysis of environmental watering outcomes available (both environmental and community outcomes) to be produced on a statewide scale.
Average annual delivery of water for the environment from July 2016 to June 2021 (WR:09) was 743,402 ML. This was up 21% from the previous 5-year period. The amount of carryover water also increased during the past 5 years, up by 24%. This demonstrates that more water has been available and delivered for the environment during this SoE reporting period relative to the previous reporting period.
Water allocations are generally greater in wet years compared to dry years. Victoria’s total rainfall for this 5-yearly SoE reporting period increased by only 2.5%. The 21% increase in delivery of water for the environment (and the 24% increase in carryover) represent a likely relative improvement in water availability for the environment. This analysis is best interpreted as an indicative guide to water availability for the environment. Even though it has been averaged across a 5-year period, environmental water allocations, delivery and carryover fluctuate from year to year.
A robust assessment of environmental water allocations over a longer period was completed for southern Victorian river systems in 2020 as part of the Long-Term Water Resource Assessment for Southern Victoria (LTWRA). The assessment found that long-term surface water availability across southern Victoria has declined by up to 21%. The decline in water availability has not always been shared equally, with the declines falling disproportionately on the environment in some basins. The assessment also found that a smaller proportion of available water is now set aside for the environment than when the last sustainable water strategies were developed between 2006 and 2011. A LTWRA for northern Victoria has not been completed, however an assessment is planned to start in 2025.
Each year the Victorian Environmental Water Holder (VEWH) sets seasonal watering objectives. These objectives seek to achieve the best environmental outcomes with the available environmental water holdings. Monitoring and reporting of environmental watering by the Victorian Government is intended to help advance localised management of environmental water. However, there’s currently a gap in the monitoring of environmental watering outcomes at a statewide scale. It needs addressing to improve future reporting, as required by Action 3.6 of Victoria’s water plan, Water for Victoria.
The VEWH’s annual reports show that, of its planned watering actions for each of the past 3 years (2019–20 to 2021–22):
-
63% to 70% were fully achieved
-
22% to 27% were partially achieved
-
8% to 13% were not achieved.
A flow regime is a combination of the amount of water flowing through a waterway and the patterns of the flowing water (e.g. how long it lasts, how frequently it flows and how large it is). To support the river’s ecological processes (e.g. the life cycles of native plants and animals), scientists have recommended flow regime characteristics for Victorian waterways that need to be achieved. An analysis of river flow data for each of the 5 years from 2017–18 to 2021–22 determined that of the environmental flow study recommendations:
-
19% to 35% were fully achieved
-
43% to 51% were partially achieved
-
22% to 33% were not achieved.
The data shows that the VEWH is generally ‘fully achieving’ its potential watering actions each year. However, there remains a shortfall to fully achieve the scientifically recommended flow regimes. This highlights a gap between what Victorian river systems need from a hydrological perspective and what the VEWH can achieve from its environmental watering program.
For many catchments in Victoria, the runoff response to rainfall has declined this century, particularly during the Millennium Drought (WR:08). This means that many Victorian catchments have been getting less streamflow for a given amount of rainfall compared with past decades. Since streamflow has been below the long-term average most years this century, the status assessment for the condition of flow regimes indicator is poor.
Water for the environment is having a greater impact on fully achieving wetland watering requirements than it is on achieving optimum river flows. These results only include assessments for rivers and wetlands where environmental water is being delivered. It incorporates most of the regulated rivers in Victoria but only a small percentage of regulated wetlands. Higher achievement of recommended water regimes is likely occurring in wetlands because environmental watering targets many of Victoria’s highest value wetlands. In some instances, dedicated environmental infrastructure (e.g. pumps) is deployed to deliver environmental water entitlements to priority and icon sites. In contrast, environmental watering of river systems is more heavily impacted by:
-
available volumes of held environmental entitlements
-
the natural seasonal conditions in any given water year
-
physical constraints within delivery systems (e.g. outlet valve capacities)
-
policy constraints (e.g. the obligation to avoid flooding towns and private land).
Report card
Inland waters - Water quality
| Location | |||
|
Statewide |
|||
| Location | STATUS | TREND | CONFIDENCE |
|
Statewide |
|||
| Location | |||
|
CMAs |
|||
| Location | STATUS | TREND | CONFIDENCE |
|
CMAs |
|||
| Location | |||
|
CMAs |
|||
| Location | STATUS | TREND | CONFIDENCE |
|
CMAs |
|||
* 7 CMAs
| Location | |||
|
CMAs |
|||
| Location | STATUS | TREND | CONFIDENCE |
|
CMAs |
|||
* 2 CMAs
| Location | |||
|
CMAs |
|||
| Location | STATUS | TREND | CONFIDENCE |
|
CMAs |
|||
* 1 CMA
| Location | |||
|
CMAs |
|||
| Location | STATUS | TREND | CONFIDENCE |
|
CMAs |
|||
*3 CMAs based on 2010-2017 data; 4 CMAs based on 2018-2021 data
| Location | |||
|
CMAs |
|||
| Location | STATUS | TREND | CONFIDENCE |
|
CMAs |
|||
* 3 CMAs
| Location | |||
|
CMAs |
|||
| Location | STATUS | TREND | CONFIDENCE |
|
CMAs |
|||
*3 CMAs based on 2010-2017 data; 2 CMAs based on 2018-2021 data
| Location | |||
|
CMAs |
|||
| Location | STATUS | TREND | CONFIDENCE |
|
CMAs |
|||
* Mallee CMA
| Location | |||
|
CMAs |
|||
| Location | STATUS | TREND | CONFIDENCE |
|
CMAs |
|||
*2 CMAs based on 2010-2017 data; 4 CMAs based on 2018-2021 data
| Location | |||
|
CMAs |
|||
| Location | STATUS | TREND | CONFIDENCE |
|
CMAs |
|||
* 4 CMAs
| Location | |||
|
CMAs |
|||
| Location | STATUS | TREND | CONFIDENCE |
|
CMAs |
|||
*3 CMAs based on 2010-2017 data; 1 CMA based on 2018-2021 data
| Location | |||
|
CMAs |
|||
| Location | STATUS | TREND | CONFIDENCE |
|
CMAs |
|||
* Mallee CMA
| Location | |||
|
CMAs |
|||
| Location | STATUS | TREND | CONFIDENCE |
|
CMAs |
|||
*5 CMAs based on 2010-2017 data; 10 CMAs based on 2018-2021 data
| Location | |||
|
CMAs |
|||
| Location | STATUS | TREND | CONFIDENCE |
|
CMAs |
|||
*5 CMAs based on 2010-2017 data; 0 CMAs based on 2018-2021 data
| Location | |||
|
CMAs |
|||
| Location | STATUS | TREND | CONFIDENCE |
|
CMAs |
|||
*10 CMAs based on 2010-2017 data; 7 CMAs based on 2018-2021 data
| Location | |||
|
CMAs |
|||
| Location | STATUS | TREND | CONFIDENCE |
|
CMAs |
|||
*0 CMAs based on 2010-2017 data; 2 CMAs based on 2018-2021 data
| Location | |||
|
CMAs |
|||
| Location | STATUS | TREND | CONFIDENCE |
|
CMAs |
|||
* 1 CMA
| Location | |||
|
CMAs |
|||
| Location | STATUS | TREND | CONFIDENCE |
|
CMAs |
|||
*2 CMAs based on 2010-2017 data; 1 CMA based on 2018-2021 data
| Location | |||
|
CMAs |
|||
| Location | STATUS | TREND | CONFIDENCE |
|
CMAs |
|||
*3 CMAs based on 2010-2017 data; 8 CMAs based on 2018-2021 data
| Location | |||
|
CMAs |
|||
| Location | STATUS | TREND | CONFIDENCE |
|
CMAs |
|||
*4 CMAs based on 2010-2017 data; 0 CMAs based on 2018-2021 data
| Location | |||
|
CMAs |
|||
| Location | STATUS | TREND | CONFIDENCE |
|
CMAs |
|||
* Mallee CMA
| Location | |||
|
Statewide |
|||
| Location | STATUS | TREND | CONFIDENCE |
|
Statewide |
|||
| Location | |||
|
Statewide |
|||
| Location | STATUS | TREND | CONFIDENCE |
|
Statewide |
|||
| Location | |||
|
Statewide |
|||
| Location | STATUS | TREND | CONFIDENCE |
|
Statewide |
|||
Inland waters - Water resources
| Location | |||
|
Statewide |
|||
| Location | STATUS | TREND | CONFIDENCE |
|
Statewide |
|||
* long term
| Location | |||
|
Statewide |
|||
| Location | STATUS | TREND | CONFIDENCE |
|
Statewide |
|||
* short term
| Location | |||
|
Statewide |
|||
| Location | STATUS | TREND | CONFIDENCE |
|
Statewide |
|||
* southern rivers
| Location | |||
|
Statewide |
|||
| Location | STATUS | TREND | CONFIDENCE |
|
Statewide |
|||
* northern rivers
| Location | |||
|
Statewide |
|||
| Location | STATUS | TREND | CONFIDENCE |
|
Statewide |
|||
* southern rivers
| Location | |||
|
Statewide |
|||
| Location | STATUS | TREND | CONFIDENCE |
|
Statewide |
|||
* northern rivers
| Location | |||
|
Statewide |
|||
| Location | STATUS | TREND | CONFIDENCE |
|
Statewide |
|||
| Location | |||
|
Statewide |
|||
| Location | STATUS | TREND | CONFIDENCE |
|
Statewide |
|||
| Location | |||
|
Statewide |
|||
| Location | STATUS | TREND | CONFIDENCE |
|
Statewide |
|||
| Location | |||
|
Statewide |
|||
| Location | STATUS | TREND | CONFIDENCE |
|
Statewide |
|||
| Location | |||
|
Statewide |
|||
| Location | STATUS | TREND | CONFIDENCE |
|
Statewide |
|||
* most shallow aquifers
| Location | |||
|
Statewide |
|||
| Location | STATUS | TREND | CONFIDENCE |
|
Statewide |
|||
* shallow aquifers in northern region; lower aquifers in Gippsland and northern region
| Location | |||
|
Statewide |
|||
| Location | STATUS | TREND | CONFIDENCE |
|
Statewide |
|||
| Location | |||
|
Statewide |
|||
| Location | STATUS | TREND | CONFIDENCE |
|
Statewide |
|||