Land

Background
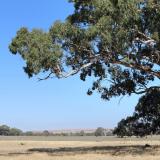
Victoria’s land stretches across nearly 23 million hectares.
National parks, conservation reserves, and forest reserves cover 40% of the state. Primary production covers 52%. The remaining land area is zoned for residential, industrial or commercial use, or used for roads and other infrastructure. Most public land is managed by:
-
the Department of Energy, Environment and Climate Action (DEECA)
-
Parks Victoria
-
79 local councils (managing 3,000 reserves)
-
1,200 committees of management with more than 8,000 volunteers (managing 1,500 reserves).
Agriculture is the dominant use of Victorian land. It is divided between mixed farming and grazing (23.2 % of Victoria), cropping (16.5%) and livestock grazing and production (8.4%). Victorian agriculture comprises more than 20,000 farm businesses and 77,000 jobs. In 2020-21 agricultural production contributed more than $7 billion to the state's economy.
Victoria is Australia's leading producer of:
-
milk
-
sheep meat
-
wool
-
fruit and nuts
-
table and dried grapes.
It’s also the number one exporter of:
-
dairy
-
sheep meat
-
wool
-
horticulture
-
poultry meat.
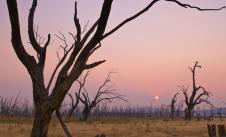
Since colonisation, more than 14 million hectares (60%) of Victorian land has been cleared, mainly for agriculture and settlements. The Australian State of the Environment 2021 Report states:
“Land clearing can also lead to processes that degrade soils, such as erosion, salinisation, loss of organic matter and depleted fertility. Native vegetation clearing in Australia is driven mainly by expansion of land dedicated to agriculture and, to a lesser extent, forestry and infrastructure, including urban development.”
There are 2 forms of salinity that affect soil in Victoria - dryland and irrigation salinity. Both interact with underground salt deposits formed over time from rock erosion and ocean deposits. Irrigation salinity is caused by irrigation raising the water table and bringing ancient salt to the surface. Where land has been cleared, there’s less vegetation to use the rain that falls. As a result, the rain seeps deeper underground, causing the water table to rise, bringing salt to the surface and leading to land degradation.
Victoria is divided into 10 catchment and land protection regions. Catchment Management Authorities (CMAs) are responsible for the land, water and biodiversity management in these regions. Each year, they assess the condition of the land in their regions. The most recent CMA assessments contain positive findings about land condition including increased total vegetation cover and reduced soil exposure due to wet years, and improved land management practices. However, declining native vegetation, poor health of public land and the legacy of past land clearing continue to pose challenges for lang managers.
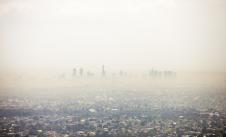
Land health and good land management are critical to biodiversity, agricultural productivity and public health outcomes. For instance, the protection of drinking-water catchments and urban greening and cooling can help reduce the urban heat island effect. Adopting sustainable land use and management practices like this can help improve the status of the indicators assessed in this key topic.
Overview
Land use and land health are inextricably linked. The way land is used and managed can improve or degrade land cover and land health.
The indicators in this key topic measure land health through:
-
soil carbon storage
-
soil erosion
The indicators also measure the natural resource management (NRM) actions being undertaken to maintain, restore and improve it, by:
-
government agencies
-
scientists
-
farmers
-
land managers
-
community organisations.
The first 3 indicators, L:01 to L:03, consider the mix and changing nature of land-cover classes and land tenure. In general, land-cover classes associated with human-based activities have continued to increase. Natural land-cover classes have continued to decline. This changing mix of land-cover is most apparent in Melbourne and regional growth areas. There has been little change in land tenure.
Indicator L:04 assesses the impacts of population growth and demographic shifts. It also compares the advantages and disadvantages of infill and greenfield development. Although a planning boundary currently limits the extent of Melbourne's future growth, there is no clear target for the desirable mix of infill and greenfield development.
Indicators L:05 to L:08 review the impact of agricultural land use on:
-
soil organic carbon
-
soil erosion
-
soil acidification
-
the extent of dryland salinity.
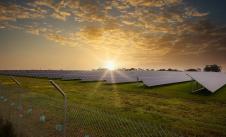
By changing land management to sequester carbon in soil, agriculture can help mitigate climate change. However, the science indicates there is still much to learn about soil carbon, its measurement, and how to increase it. The Commonwealth and Victorian governments have developed carbon farming projects. These will encourage farmers to sequester carbon in their soil. The process could take at least 25 years if it is to be successful.
Dryland salinity remains a significant concern, even though it’s receding in the state's northern river basins. This is reflected in an improving trend for the Murray River catchment in indicator L:06. The improvement is due to better land management and the major reduction in groundwater levels caused by the Millennium Drought (1998-2009). Those dry years lowered the groundwater levels and reduced the volume of saline groundwater discharged to the land surface. As a result, the area of dryland salinity has reduced. The reverse can occur in wet years. Although recent wet years have recharged much of the groundwater lost, groundwater discharges have not returned to previous levels.
Indicator L:07 finds the extent of acidic soils in medium rainfall areas has increased due to historical farm management practices. This is likely having a negative effect on agricultural productivity and economic returns to farmers. As well as potentially increasing soil erosion and salinity, while impacting soil biodiversity.
Indicator L:08 considers the risk of soil erosion to Victoria's land health. The threat of wind erosion is highest in the sandy plains of the Mallee and Wimmera regions. Erosion caused by water is mostly in the sloping higher rainfall areas of the central west. The National Landcare Program has developed targets for total vegetation cover for each NRM region. Maintaining total vegetation cover (trees, shrubs, grasses and herbage) above critical levels is a well-established way of improving soil condition. If those targets are met, the threat of wind and water erosion should be significantly reduced.
Up to 30,000 sites in Victoria are estimated to be contaminated with pollution. Half of these are rated as being ‘high risk’ (L:09). Across the state, an increasing amount of land remediation is taking place. A variety of data sources indicate industrial areas remain distinct hotspots for contaminated sites.
Indicators L:10 and L:11 assess volunteer engagement in NRM activities and the work of landholders to adopt best-practice to progress sustainability in agriculture. Individual and community participation in NRM activities is significant and widespread. It’s supported by government agencies, including Catchment Management Authorities (CMAs). The agriculture sector is increasingly investing in best practices with sustainability outcomes. However, publicly available data on the extent and outcomes of sustainable agriculture programs are limited.
Report card
| Location | |||
|
Statewide |
|||
| Location | STATUS | TREND | CONFIDENCE |
|
Statewide |
|||
| Location | |||
|
Statewide |
|||
| Location | STATUS | TREND | CONFIDENCE |
|
Statewide |
|||
| Location | |||
|
Statewide |
|||
| Location | STATUS | TREND | CONFIDENCE |
|
Statewide |
|||
| Location | |||
|
Melbourne metropolitan area |
|||
| Location | STATUS | TREND | CONFIDENCE |
|
Melbourne metropolitan area |
|||
| Location | |||
|
Statewide |
|||
| Location | STATUS | TREND | CONFIDENCE |
|
Statewide |
|||
| Location | |||
|
Murray River catchment |
|||
| Location | STATUS | TREND | CONFIDENCE |
|
Murray River catchment |
|||
| Location | |||
|
Elsewhere across Victoria |
|||
| Location | STATUS | TREND | CONFIDENCE |
|
Elsewhere across Victoria |
|||
| Location | |||
|
Statewide |
|||
| Location | STATUS | TREND | CONFIDENCE |
|
Statewide |
|||
| Location | |||
|
Statewide |
|||
| Location | STATUS | TREND | CONFIDENCE |
|
Statewide |
|||
* wind
| Location | |||
|
Statewide |
|||
| Location | STATUS | TREND | CONFIDENCE |
|
Statewide |
|||
* water
| Location | |||
|
Statewide |
|||
| Location | STATUS | TREND | CONFIDENCE |
|
Statewide |
|||
| Location | |||
|
Statewide |
|||
| Location | STATUS | TREND | CONFIDENCE |
|
Statewide |
|||
| Location | |||
|
Statewide |
|||
| Location | STATUS | TREND | CONFIDENCE |
|
Statewide |
|||