Key Topic: Air

Background
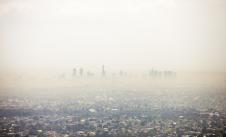
Good air is essential to human health. The links between population exposure to air pollution and adverse health effects are now well established. Evidence tells us air pollution is connected to poor health, even when pollution levels are below our current air quality standards.
Particle pollutants are most commonly associated with poor air quality in Victoria. Particle pollutants are categorised by their size. They are so small they’re measured in micrometres – one micrometre is 0.001 millimetres. There are 2 main particle pollutants measured in Victoria. These are:
-
PM2.5 - particles less than 2.5 micrometres in diameter
-
PM10 - particles less than 10 micrometres in diameter.
PM2.5 particles are approximately 30 times smaller than the width of an average human hair. They’re smaller than PM10 and can be inhaled deeper into the lungs, which means they carry a greater health risk. Higher levels of these particles in the air can cause wheezing, chest tightness and difficulty breathing in people with existing heart or lung conditions (including asthma).
As the population of Victoria grows and ages, the health impacts of poor air quality will increase, unless there’s a decrease in air pollution.
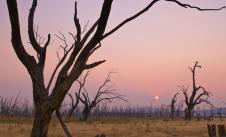
Climate change will also intensify existing threats to air quality. Higher temperatures and longer periods of reduced rainfall are likely to increase the risk of frequent and severe fires and dust storms and worsen conditions for summer smog.
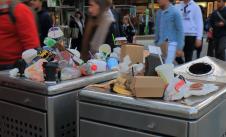
Odour and noise can also impact health and wellbeing. They are the most frequent types of pollution reported to the Environment Protection Authority (EPA) Victoria. Each caused more than 5,000 pollution reports to EPA Victoria during 2020-21.
Pollen and light pollution
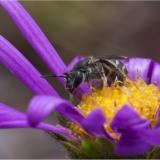
Pollen and light pollution are also included in this chapter. Grass pollen is a focus in Victoria because it’s a major outdoor allergen. Its impact on the community affects health services.
Pollen from grasses, weeds or trees can trigger symptoms of allergic rhinitis (hay fever), and asthma. Victoria has the second highest rate (23%) of hay fever in Australia.
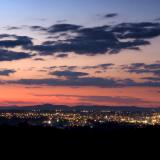
Light pollution
Light pollution is a global issue, impacting at national and regional scales. It is increasing in prevalence as the world becomes more populated and industrialised.
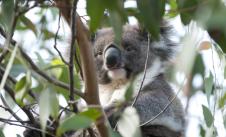
Light pollution threatens reproduction and migratory habits of insects, amphibians, fish, birds, bats and other animals.
Overview
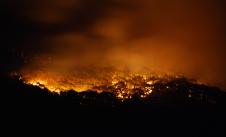
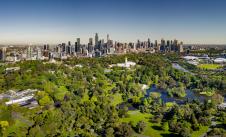
Victoria’s air quality is considered good by international standards. However, poor air quality is still measured occasionally during major incidents (e.g. bushfires), near major industrial facilities, due to smoke from domestic wood heaters, and during periods of planned burns.
Data from EPA Victoria shows that 79% of the Victorian population were exposed to annual PM2.5 concentrations exceeding the air quality standard in 2020 – this was in a year with significant bushfire smoke impacts. By comparison, in a year without significant bushfire smoke impacts (2021), it was 18%.
Air quality, particularly particle pollution, was generally worse in this reporting period than during the previous State of the Environment (SoE) reporting period. This was largely due to bushfire smoke impacts. However, air quality was generally better in 2020 and 2021 in Melbourne's suburbs and across areas of regional Victoria. This was likely due to increased rainfall during 2021 and travel restrictions in response to the COVID-19 pandemic. Travel restrictions resulted in reduced motor vehicle emissions while the restrictions were in effect.
This report is the first time pollen has been captured within a SoE indicator assessment (A:07) – see the Report Card below. There are 8 pollen monitoring sites across Victoria. At these sites there has been a generally increasing trend in days of extreme or high grass pollen since 2017. Most recently this has been influenced by a multi-year La Niña state. This has been leading to increased rainfall and grass pollen. However, from 2017 to 2019 (prior to the La Niña state) Victoria was still averaging 20 to 40 days of extreme or high grass pollen per season.
Odour (A:08) remains generally the type of pollution most frequently reported to EPA Victoria. They received more than 3,000 odour reports in each of the past 9 years. This report provides details on EPA Victoria's recent achievements to support and regulate industry. Their efforts to improve odour management practices are likely to help reduce odour impacts on communities over time.
Prior to 2020-21, noise (A:09) was generally the pollution second most frequently reported to EPA Victoria, after odour. However, since the shift to remote working, there has been a sharp increase in the number of noise pollution reports received. Noise was the type of pollution most frequently reported to EPA Victoria in 2020-21. This is due to the increased number of people exposed to noise. For instance, people working from home near industrial facilities hearing trucks during the day, where previously they would have been in the office and wouldn’t have heard the noise.
As reported in SoE 2018, light pollution across the world is being measured by satellites. However, this data is not routinely analysed in Victoria (A:10). Furthermore, there are no national or state thresholds to guide a status assessment of light pollution in Victoria. New analyses completed for this report highlights dramatic light pollution increases in Melbourne's growth areas. For example, the night-time light emissions in growth areas of Melbourne's outer western suburbs have nearly tripled from 2014 to 2021. These calculations have been complemented by summaries of research investigating how light pollution threatens wildlife.
Report card
| Location | |||
|
Geelong |
|||
| Location | STATUS | TREND | CONFIDENCE |
|
Geelong |
|||
| Location | |||
|
Latrobe Valley and Melbourne |
|||
| Location | STATUS | TREND | CONFIDENCE |
|
Latrobe Valley and Melbourne |
|||
| Location | |||
|
Elsewhere across Victoria |
|||
| Location | STATUS | TREND | CONFIDENCE |
|
Elsewhere across Victoria |
|||
| Location | |||
|
Latrobe Valley |
|||
| Location | STATUS | TREND | CONFIDENCE |
|
Latrobe Valley |
|||
| Location | |||
|
Geelong and Melbourne |
|||
| Location | STATUS | TREND | CONFIDENCE |
|
Geelong and Melbourne |
|||
| Location | |||
|
Statewide |
|||
| Location | STATUS | TREND | CONFIDENCE |
|
Statewide |
|||
| Location | |||
|
Statewide |
|||
| Location | STATUS | TREND | CONFIDENCE |
|
Statewide |
|||
* Melbourne
| Location | |||
|
Statewide |
|||
| Location | STATUS | TREND | CONFIDENCE |
|
Statewide |
|||
* Geelong and Latrobe Valley
| Location | |||
|
Statewide |
|||
| Location | STATUS | TREND | CONFIDENCE |
|
Statewide |
|||
| Location | |||
|
Statewide |
|||
| Location | STATUS | TREND | CONFIDENCE |
|
Statewide |
|||
* years with significant bushfires
| Location | |||
|
Statewide |
|||
| Location | STATUS | TREND | CONFIDENCE |
|
Statewide |
|||
* other years
| Location | |||
|
Statewide |
|||
| Location | STATUS | TREND | CONFIDENCE |
|
Statewide |
|||
| Location | |||
|
Statewide |
|||
| Location | STATUS | TREND | CONFIDENCE |
|
Statewide |
|||
| Location | |||
|
Statewide |
|||
| Location | STATUS | TREND | CONFIDENCE |
|
Statewide |
|||
| Location | |||
|
Statewide |
|||
| Location | STATUS | TREND | CONFIDENCE |
|
Statewide |
|||
| Location | |||
|
Statewide |
|||
| Location | STATUS | TREND | CONFIDENCE |
|
Statewide |
|||
| Location | |||
|
Melbourne |
|||
| Location | STATUS | TREND | CONFIDENCE |
|
Melbourne |
|||
| Location | |||
|
Elsewhere across Victoria |
|||
| Location | STATUS | TREND | CONFIDENCE |
|
Elsewhere across Victoria |
|||
| Location | |||
|
Schools and aged care facilities |
|||
| Location | STATUS | TREND | CONFIDENCE |
|
Schools and aged care facilities |
|||
| Location | |||
|
Statewide |
|||
| Location | STATUS | TREND | CONFIDENCE |
|
Statewide |
|||
* residential buildings during periods of bushfire smoke
| Location | |||
|
Statewide |
|||
| Location | STATUS | TREND | CONFIDENCE |
|
Statewide |
|||
* all other scenarios
| Location | |||
|
Statewide |
|||
| Location | STATUS | TREND | CONFIDENCE |
|
Statewide |
|||