Climate change

Background
Climate research continues to show temperatures, sea levels and sea-surface temperatures rising in Australia.
Further changes to the climate will drive ongoing and significant ecosystem and biodiversity impacts. It will expose Victorians to more frequent and intense droughts, fires, heatwaves, extreme rainfall events and rising sea levels. This key topic summarises the effect climate change is having in these areas, as well as the potential future implications.
Victoria’s climate is influenced by a range of factors. This includes the effect of major ocean–atmosphere phenomena such as the El Niño–Southern Oscillation. This produces El Niño and La Niña events, and the Indian Ocean Dipole. These drivers of climate contribute to large natural year-to-year variations in temperature and rainfall. However, long-term climate change caused by increasing greenhouse gas concentrations is occurring at global scales. The Intergovernmental Panel on Climate Change (IPCC) reported in 2021 that human activities are responsible for approximately 1.1°C of global warming since the period of 1850 to 1900.
The link between increasing greenhouse gas concentrations and climate change has been a growing area of focus for policy-makers since countries adopted the United Nations Framework Convention on Climate Change in 1992. This was a precursor to the adoption of the Kyoto Protocol in 1997 and the Paris Agreement in 2015.
The challenges associated with mitigating and adapting to climate change impacts are significant. Rising to these challenges is a current and critical need as the magnitude of climate change, and its associated adverse impacts, are being increasingly experienced. For Victoria, the Climate Science Report 2019 followed on from the findings and assessments made in the Climate change impacts chapter of the SoE 2018 Report. They highlighted the observed trends and local-scale projections of increased intensity and frequency of climate extremes such as heatwaves, high fire danger days and intense rainfall in the future. The Victorian Climate Science Report 2019 also built on the knowledge gained from the Victorian Government’s investment in climate science. Key findings from the Victorian Climate Science Report 2019 and Victorian Climate Projections 2019 have been incorporated in the report card for this topic (see below).
The IPCC 6th Assessment Synthesis Report was released in 2023, and is expected to inform Victoria’s next Climate Science Report, due in 2024. It’s imperative that planning and policy development continues to leverage climate science to enable decision-making that fully prepares Victoria to manage climate change impacts.
Overview
The 13 indicators assessed within 'Climate change impacts' and 'Climate change mitigation' highlight a generally poor environmental status with a deteriorating trend. These assessments are made with high confidence. None of the 13 indicators have been assessed as having a good status. These assessments are generally similar to the assessments for their counterparts in the SoE 2018 Report.
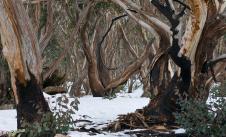
For indicators CCIm:01 to CCIm:10 within the 'Climate change impacts' theme, all indicator assessments were generally consistent with those in the SoE 2018 Report. The same 10 indicators were all assessed as deteriorating. The exception to this was the higher altitude alpine resorts where the snow cover trend was upgraded from ‘deteriorating’ to ‘stable’.
The temperature increases in Victoria that were reported during the SoE 2018 Report have continued. Data from the Bureau of Meteorology (BoM) shows that 7 years during the past decade (2012-2021) have been in the top-ten warmest years on record for Victoria.
Long-term temperature trend
Australia is a signatory to the Paris Agreement. The central aim of the agreement is:
-
holding the increase in the global average temperature to well below 2°C above pre-industrial levels
-
pursuing efforts to limit the temperature increase to 1.5°C above pre-industrial levels.
The pre-industrial period has been defined as 1850-1900.
Indicator CCIm:01 ‘Observed surface temperature' details that annual average temperatures for Melbourne are approaching a 1.5°C degree increase from the pre-industrial era. In fact, some years are now more than 1.5°C warmer than the indicative pre-industrial era baseline. The results of this comparison with an indicative pre-industrial era baseline temperature are consistent with recent Australian research. It found Australia had warmed by approximately 1.5°C from 1850 to 2019.
The warming in Melbourne reflects both broader climate change and the impacts of urbanisation within metropolitan Melbourne. Betweeb 1992 and 2021, Melbourne has warmed by 0.99°C from an average of 19.6°C (1992-2001) to 20.5°C (2012-2021).
If the rate of temperature increase was to continue at the current trajectory of nearly 0.5°C per decade, temperatures in Melbourne will increase by approximately 2.5°C from pre-industrial levels by the 2040s.
Across Victoria the mean annual temperature between 1910 and 2018 had increased by 1.2°C. This was recorded in the Technical Report for the Victorian Climate Projections 2019 project based on ACORN-SAT temperature data.
The observed temperature increase is significant in the context of Australia being a signatory to the Paris Agreement. However, it is important to note that the warming assessed in this report is representative of land-based warming. The Paris Agreement aim includes both land and ocean temperatures. Globally, land is warming faster than oceans, with IPCC assessments determining land warming at 1.6°C, ocean warming at 0.9°C and the combined land/ocean warming at 1.1°C.
Extreme weather
During recent years, below average rainfall conditions have dominated the climate and extended the overall drying pattern affecting the state. Above-average rainfall has only been recorded for 5 of the past 25 years (1997-2021) in Victoria. Further analysis is provided in CCIm:02.
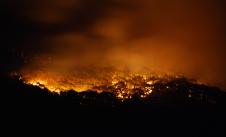
During this century there has been a significant increase in the number of days per year when Victorian temperatures are unusually hot. This is linked with increasing heatwave and bushfire risks. A drier climate with more intense rainfall events has also been experienced during recent years. There are several examples of catastrophic natural disaster events associated with climate change since the SoE 2018 Report. These are detailed in the assessment for CCIm:10.
The financial cost of natural disasters is increasing in Victoria. It’s projected to be at least $185 billion cumulatively between 2020 to 2060.
Climate projections
The climate projections in indicators CCIm:06 to CCIm:09 are generally consistent with the findings summarised in the SoE 2018 Report. Physical evidence, past trends and various models all suggest Victoria will continue warming this century. An ongoing warming is projected with high confidence. Inland regions of Victoria are projected to warm by a greater amount (2.4°C) compared to coastal regions (1.9°C) by the 2050s.
The number of very hot days in Victoria is projected to double across the state by the 2050s under a high emissions pathway.
The assessments for the indicators in the 'Climate projections' sub-theme are generally based on results from the Victorian Climate Projections project (VCP19). Since then, a new generation of global climate models have been developed (CMIP6). These were featured in the 2021 IPCC sixth assessment report that included a new set of emission scenarios. This new modelling and scenarios are yet to be downscaled and applied for Victoria.
While the impact of climate change on Victorian rainfall is expected to increase in the 21st century, large natural variability will also occur. In some years and decades, this natural variability will exacerbate the underlying drying. While in other periods the underlying drying will be balanced out by natural climatic events such as La Niña.
By the 2050s, Victoria is likely to experience more extreme, short-duration rainfall despite an overall decrease in rainfall.
Data provided by BoM shows that mean and maximum sea levels are gradually increasing. This is exerting pressure on coastal settlements and infrastructure. Future rises in sea level are projected with high confidence.
Sea levels are expected to rise by approximately 12 cm at some places along Victoria’s coastline by 2030. A rise of approximately 40 cm is projected by 2070.
Mitigation
Within Mitigation, 3 indicators were assessed as having a fair status and none have a deteriorating trend. The distinct area of improvement since the SoE 2018 Report is that Victoria's annual net greenhouse gas emissions have reduced by 27% over the period 2015 to 2020. This represents the 5 most recent years with available data. Victoria's CC Act 2017 established a long-term target of net-zero greenhouse gas emissions by 2050 and a requirement to set 5-yearly interim emissions reduction targets. They also set a foundational target for emissions to be 15% to 20% below 2005 levels by 2020. This has been achieved.
Victoria’s total net greenhouse gas emissions were 30% lower in 2020 compared with 2005 levels.
This has meant that the status assessment for CCM:11 has been upgraded to fair in this report from poor in 2018.
Adaptation
The Adaptation theme presents a suite of indicators designed to improve climate change adaptation for future SoE reporting. It incorporates 10 new indicators, as well as modified forms of existing Victorian SoE indicators.
The Victorian Government has prepared Adaptation Action Plans (AAPs) across 7 essential systems to ensure Victoria’s climate resilience. The 7 systems are:
-
Built Environment
-
Education and Training
-
Health and Human Services
-
Natural Environment
-
Primary Production
-
Transport
-
Water Cycle.
The AAPs emphasise that the natural environment is the foundation of all the other systems. It shapes the climate change risk we face and the success of our adaptation efforts. The natural environment fundamentally provides not only the context in which human systems and regions exist but specific ecological services that enable human life and activities.
The Victorian Government, in consultation with community, has also developed Regional Climate Change Adaptation Strategies. Regional Climate Change Adaptation Strategies (RASs) are 5-year practical strategies to address the unique challenges and opportunities climate change brings to Victoria’s regions and guide locally relevant practical action. The adaptation indicators aim to help track and monitor progress against the AAPs and guide ongoing work on the RASs.
Successful climate change adaptation:
-
is fundamental to our ongoing ability to function and achieve other climate goals, including greenhouse gas mitigation.
-
requires interventions that intentionally address the impacts and risks of climate change on natural and human systems.
-
reduces the negative consequences of interactions between all existing systems and emergent climatic shifts, hazards and their flow-on effects.
-
includes not only the management of increasingly frequent and severe disasters but anticipation and avoidance of larger, longer-term, aggregate future threats.
Report card
Climate change - Impacts
| Location | |||
|
Statewide |
|||
| Location | STATUS | TREND | CONFIDENCE |
|
Statewide |
|||
| Location | |||
|
Statewide |
|||
| Location | STATUS | TREND | CONFIDENCE |
|
Statewide |
|||
| Location | |||
|
Falls Creek, Mount Buller, Mount Hotham |
|||
| Location | STATUS | TREND | CONFIDENCE |
|
Falls Creek, Mount Buller, Mount Hotham |
|||
| Location | |||
|
Mount Baw Baw, Lake Mountain |
|||
| Location | STATUS | TREND | CONFIDENCE |
|
Mount Baw Baw, Lake Mountain |
|||
| Location | |||
|
Victoria’s coastline |
|||
| Location | STATUS | TREND | CONFIDENCE |
|
Victoria’s coastline |
|||
| Location | |||
|
Victoria's marine environment |
|||
| Location | STATUS | TREND | CONFIDENCE |
|
Victoria's marine environment |
|||
| Location | |||
|
Statewide |
|||
| Location | STATUS | TREND | CONFIDENCE |
|
Statewide |
|||
| Location | |||
|
Statewide |
|||
| Location | STATUS | TREND | CONFIDENCE |
|
Statewide |
|||
| Location | |||
|
Statewide |
|||
| Location | STATUS | TREND | CONFIDENCE |
|
Statewide |
|||
| Location | |||
|
Victoria’s coastline |
|||
| Location | STATUS | TREND | CONFIDENCE |
|
Victoria’s coastline |
|||
| Location | |||
|
Statewide |
|||
| Location | STATUS | TREND | CONFIDENCE |
|
Statewide |
|||
Climate change - Mitigation
| Location | |||
|
Statewide |
|||
| Location | STATUS | TREND | CONFIDENCE |
|
Statewide |
|||
| Location | |||
|
Land sector |
|||
| Location | STATUS | TREND | CONFIDENCE |
|
Land sector |
|||
| Location | |||
|
Marine and coastal sector |
|||
| Location | STATUS | TREND | CONFIDENCE |
|
Marine and coastal sector |
|||
| Location | |||
|
Statewide |
|||
| Location | STATUS | TREND | CONFIDENCE |
|
Statewide |
|||
Climate change - Adaptation
No indicator assessments have been undertaken for this theme